Hello,
I'm currently trying to create historical swaps curves using bloomberg data. However, I'm encountering the problem many days (partially every second) got one or more kinks in the forward curve (especially before 2013), somethign like this (blue = LIBOR, red = OIS, both 24 motnhs forwards) :
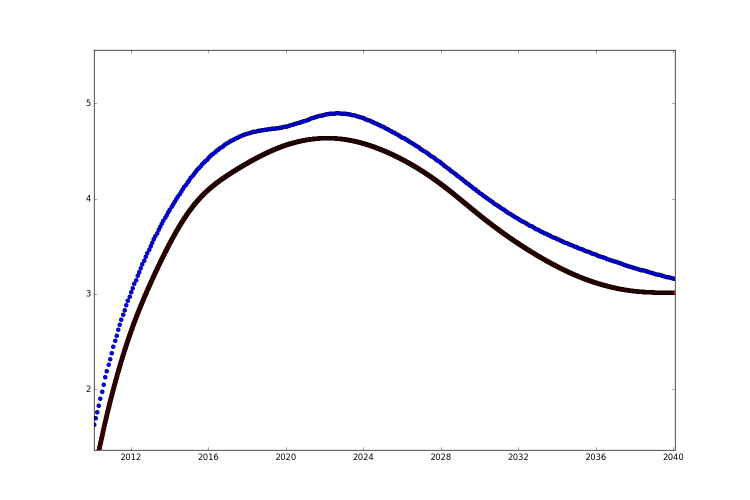
I'm currently using a MonotonicLogCubic interpolation on discount rates.
So eventually my
main question is, how can i best get rid of these kinks in a systematic way. So far I just tried to switch between different bloomberg sources, drop tenors, etc. But of course all of these solutions are not ideal.
But I also got a few other questions for my understanding(if anyone has a answer for any of those particular ones):
1) As I understand MonotonicLogCubic interpolation on discount rates should already produce smooth forward rates. Is this the best way to produce smooth forwards? For my understanding how QL works, interpolation on forwards, would it be much more volatile as QL calculates the forwards from each tenor to tenor and then tries to fit a spline exactly on those forward rates and it just 'happend to be' that MonotonicLogCubic and discount rates are a good team to create smooth forwards? Also what exactly is the accuracy for?
2) Switching MonotonicLogCubic to forward rates actually doesnt work, i get the following error:
RuntimeError: 1st iteration: failed at 1st alive instrument, pillar July 26th, 2010, maturity July 26th, 2010, reference date January 25th, 2010: invalid value (-1) at index 0Is there any way to get this working? But in case it wouldnt produce smoother curves, I guess it doesnt matter anyhow?
3) I tried to export e.g the KrugerCubic, FritschButlandCubic in piecewiseyieldcurve.i but I was getting errors and wasn't able to recompile QuantLib. Is it possible to export those? Do I have to change any other files? Would it even potentially help for my problem at all?
4) Would bootsrapping on forward swap rates (in bbg tickers e.g. EUSA1002) help? I'm not quite sure about the quality of bbg data there and my code currrently is build specifically for straight swaps, so I thought to ask if anyone has some experiences with this.
5) How can I best teach myself how to use QuantLib in Pyhton? I've read Lugi's Python Cookbook, but when it comes to function which aren't described there, I'm just randomly test around. Learn C++ and read Luigi's C++ QuantLib book? Or are there also some other easier ways to quickly learn more about QuantLib structure and functions without digging into every detail?
6) Any other ideas how I could improve the smoothness of the curve without giving up on other details of the curve?
Further info, the libor curve was created purely with swaps (and depo), with the follwing tenors (date: 25-Jan-2010):
['6M', '1Y', '2Y', '3Y', '4Y', '5Y', '7Y', '10Y', '12Y', '15Y', '20Y', '25Y', '30Y', '40Y', '50Y']
EONIA was created with FRAs and OIS swaps:
['1x7', '2x8', '3x9', '4x10', '5x11', '6x12', '9x15', '12x18']
['3M', '6M', '1Y', '2Y', '3Y', '4Y', '5Y', '7Y', '10Y', '12Y', '15Y', '20Y', '25Y', '30Y', '40Y', '50Y']

