Re: Test suite run time
Posted by Peter Caspers-4 on
URL: http://quantlib.414.s1.nabble.com/Test-suite-run-time-tp17128p17134.html
------------------------------------------------------------------------------
_______________________________________________
QuantLib-dev mailing list
[hidden email]
https://lists.sourceforge.net/lists/listinfo/quantlib-dev
URL: http://quantlib.414.s1.nabble.com/Test-suite-run-time-tp17128p17134.html
Hello,
to give a benchmark, it takes around 8h to run memcheck on the whole test-suite, which means a slow-down factor of approximately 50x. This is with -O3 though, which may hide or produce bogus uninitialized value errors under certain (but rare) circumstances (according to the valgrind documentation). Since its diagnostics concerning memory errors seems pretty much exhaustive (it is e.g. comparable to clang's address + memory + leak sanitizer), I am wondering what Visual Studio is (thinking it is) doing? Is it turning off optimization maybe? Or is it doing something in the direction of thread-safety?
Is it possible to switch optimization levels, debug symbol generation and sanitizing code instrumentation separately from each other in the studio? If yes, one can maybe find a viable compromise for these settings between running time and error sensitivity depending on what exactly one is expecting.
Peter
On 27 November 2015 at 09:52, Luigi Ballabio <[hidden email]> wrote:
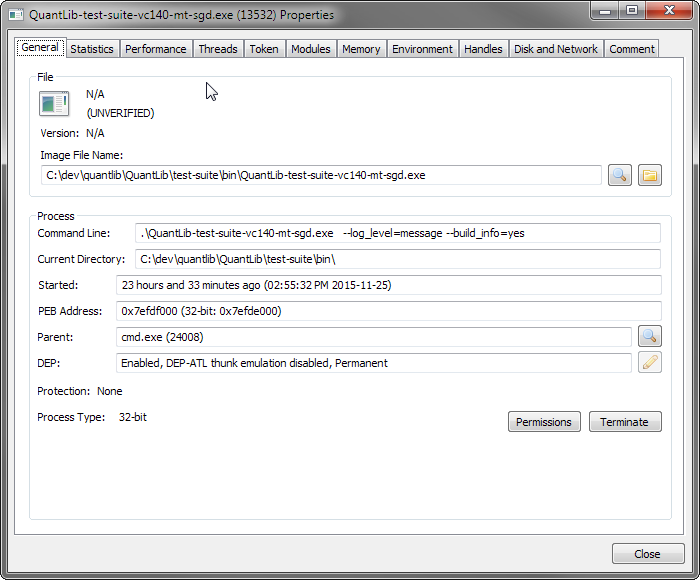
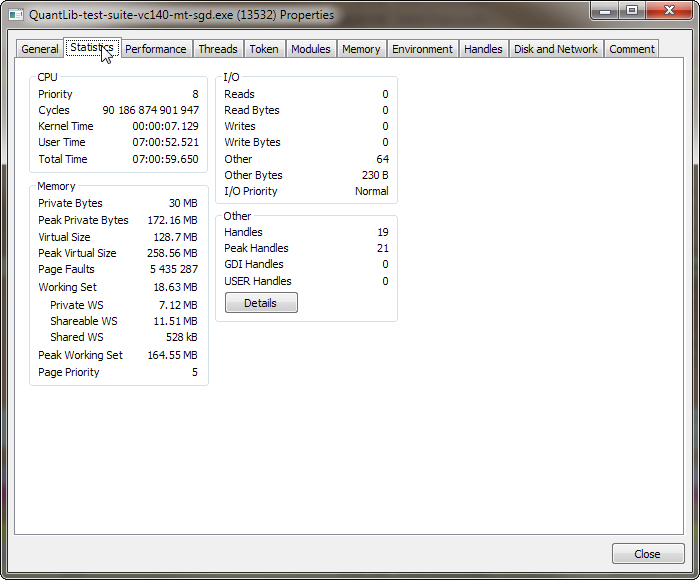
Hi Francois,in Release mode, it should be in the neighborhood of 10 minutes. I see you're running it in Debug mode, though; it adds all kinds of additional run-time checks, so it will take way more. I'm not sure how much exactly, since I haven't run it in a long time...LuigiOn Fri, Nov 27, 2015 at 9:49 AM Francois Botha <[hidden email]> wrote:------------------------------------------------------------------------------Hi all,For how long is the test suite support to run.... ballpark figure. I've got a pretty powerful 8-core machine with an SSD. I kicked off the test suite yesterday and it's been running for almost 24hours. I can see one core is being utilised at 100%. What runtime do you guys have? Does the log_level parameter affect the runtime significantly?Here are some Process Hacker screenshots of my currently running process:thanksFrancois Botha
_______________________________________________
QuantLib-dev mailing list
[hidden email]
https://lists.sourceforge.net/lists/listinfo/quantlib-dev
--
------------------------------------------------------------------------------
_______________________________________________
QuantLib-dev mailing list
[hidden email]
https://lists.sourceforge.net/lists/listinfo/quantlib-dev
------------------------------------------------------------------------------
_______________________________________________
QuantLib-dev mailing list
[hidden email]
https://lists.sourceforge.net/lists/listinfo/quantlib-dev
| Free forum by Nabble | Edit this page |